Many business owners who are jumping on the digital transformation bandwagon are swimming in a sea of tech buzzwords. These may include ‘big’ words like artificial intelligence and virtual reality. Therefore, they oftentimes fail to recognize the importance of simple tech notions like ‘website testing.’ To be fair, website performance testing does have a decent share of publicity in the tech world. However, it’s overlooked in the sense of continuous website support. Just to say ‘you should do it’ is an understatement. Website testing should be a part of your overall business strategy. Period. One useful tool you may consider for this purpose is JMeter. Stress testing a website involves simulating heavy traffic to identify and address potential bottlenecks and issues. So, here I come to the topic of the article ‘How you should perform website stress testing using JMeter.’
Contents
If you’re not a tech person, you can definitely send this article to your sysadmin. This blog post will most certainly help your effort with continuous website support. Otherwise, get comfortable, and let’s talk about website stress testing using JMeter.
Website stress testing using JMeter allows you to analyze and quickly detect issues with website performance. Moreover, it will let you know in advance when you need to buy new servers.
Website stress testing using JMeter relies on 4 criteria:
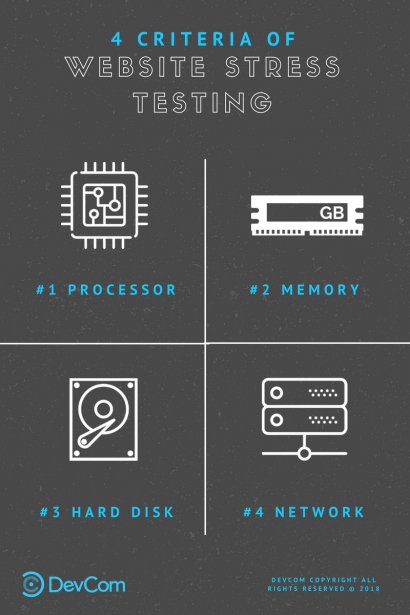
1. Processor
The processor is the most important testing criterion since it provides the main computations. You can analyze the processor data without any fancy technical background. The only thing you need to know is where to look.
Download and install a nice little tool titled TerminAll. Afterward, enter the tool and type in the ‘top’ command. You’ll see the following picture:

You can ignore most of the gibberish here except these 3 measures:
- Percentage of current processor usage (CPU). The higher the percentage – the higher load or even overload.
- Percentage of free CPU. The more free CPU – the better the potential.
- Load average. The first number shows your processor’s load average for 1 minute, the second – for 5 minutes, and the third – for 15 minutes.
The ‘load average’ number is the hardest to interpret. Depending on the number of load streams, the ‘load average’ number should be interpreted differently. Here’s an example of a 2-stream processor with a load average of 2.00, 0.40, 3.35:
1) 2.00 means the processor is loading 200% during 1 minute
2) 0.40 means the processor hasn’t been using 160% of its load potential during the last 5 minutes. In other words, no process has been in a queue during the last 5 minutes.
3) 3.35 means the processor has been overloaded 135% on average during the last 15 minutes. Meaning 1.35 processes have been in a queue during the last 15 minutes.
I told you, it’s not rocket science!
2. Memory
Moving on. We can call this criterion RAM, Random-access memory, or simply the memory. This valuable piece of data can be found by typing the ‘cat /proc/meminfo’ command into your TerminAll.

Again, you should be interested only in a few measures:
- Free memory. You always want it to be around 30-50% for all your processes to function smoothly;
- Swap memory. You definitely don’t want your memory to fall into swap since you need it at all times. That’s all!
3. Hard disk
Next. You need to conduct your hard drive capacity testing in order to know when to buy more servers.
In order to do so, type in the ‘df-h’ command.

In short, you need at least 10% of free space on your hard drive. However, keep in mind the hard drive can temporarily experience unusual load while processing files and databases.
4. Network
Lastly, high network traffic is the least important criterion to follow. Are you wondering how to stress test a website to ensure it can handle high traffic? There are various tools and techniques available to help you with website stress testing. Nevertheless, peak measures do indicate the need to scale your network in the near future. For example, average traffic of 95 MB on a 100 MB-large interface most certainly indicates the need to change your server soon.
In order to see the network traffic, type in ‘cbm’.

JMETER OVERVIEW
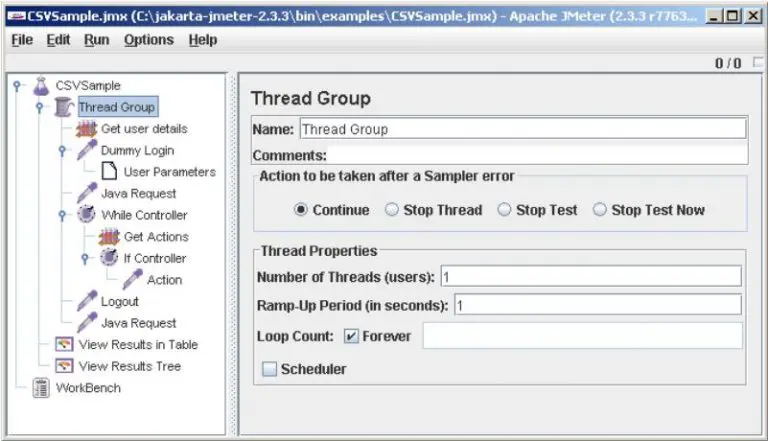
Now, we know all the measures for website stress testing using JMeter. Let’s jump to the tool itself. JMeter is a tool for load and stress testing of a whole number of services focusing on web applications. Moreover, JMeter is totally free and cross-platform.
In order to start your work with JMeter, you should follow 2 simple steps:
- Install JRE or JDK. You most definitely need one of these because JMeter is written using Java;
- Install and start JMeter. Then, behold this wonderful tool!
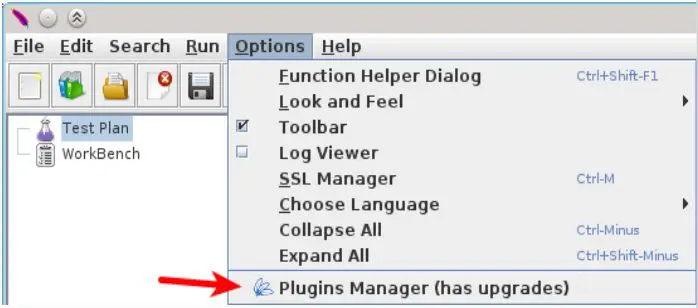
Additionally, you might want to add JMeter Plugins Manager to connect it to different other tools. Firstly, you have to download the ‘JAR plug-in manager’ file and put it into the ‘lib/ext JMeter’ catalog. Secondly, open your JMeter and go to ‘Options’ to find ‘Plugins Manager’. As simple as always!
This is a long article, and I’m glad you made it this far. I most certainly don’t want to make your life difficult, so here’s the list of almost all of the JMeter terms in one place. You’re welcome!
The list of terms to remember:
1. Number of threads (Users) is a certain number of similar virtual users (aka streams);
2. A thread group is a scenario processing a certain amount of virtual users (aka streams);
3. The ramp-up period is a period for processing all threads and thread properties;
4. A loop count is a number of scenario reiterations;
5. A scheduler is an option for scheduling your test to start at a certain period;
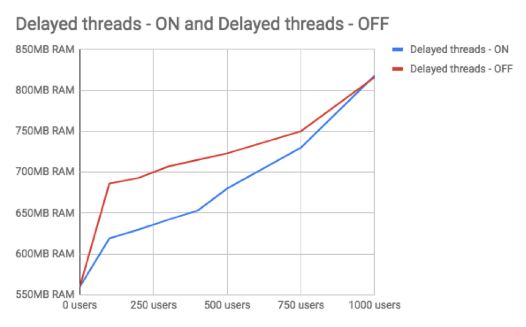
6. Delay thread creation until needed is an option for saving computer resources. The option doesn’t save the resources dramatically but can still be quite useful, as can be seen in the chart below.
The way you make JMeter work is plain and simple. You create different thread groups resembling certain theoretical behaviors of potential website users. You make the concurrent users behave as realistically as possible. Afterward, you create the necessary thread number, loop count, and ramp-up period for these separate thread groups in order to scale these behaviors. Lastly, you analyze your JMeter and TerminAll data. Job well done!
WEBSITE STRESS TESTING USING JMETER (EXAMPLE)
Finally, let’s make out how to do stress testing in Jmeter. You can follow along with your own complex testing using this JMeter stress test example as a template. So, I will show you a very simple JMeter stress test comparing 2 PHP frameworks, namely Laravel vs. Symfony. We’re using a server with 2GB RAM and a 1 GB SWAP. In addition, it has a 2-core CPU as well as a 15GB HDD.

Step 1. Create the Test Plan
I’m creating a Test Plan and running it 6 times for 2 minutes each to get reliable ‘load average’ data for proper load testing using JMeter. The test includes the following Thread Groups:
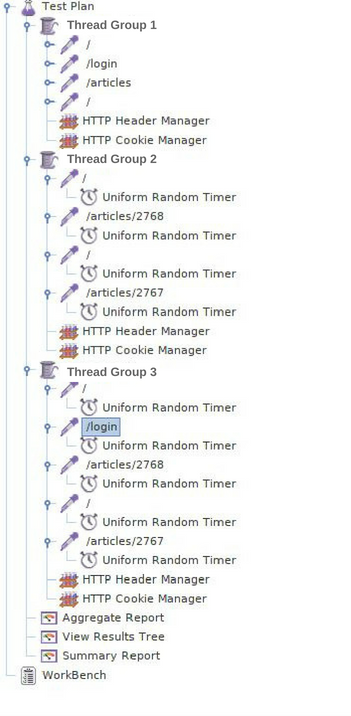
- Thread group 1
- Main Page
- Authorization
- Creating a Blog Post
- Main page
- Thread group 2
- Main Page
- Blog Post Page
- Main Page
- Blog Post Page
- Thread group 3
- Main Page
- Authorization
- Blog Post Page
- Main Page
- Blog Post Page
Step 2. Set up Threads
I’m setting up a proper number of threads, ramp-up period, and loop count for every thread separately. Thusly, I’m bringing some reality to the test.

I’m setting the ramp-up period and loop count to 1 in order to make it more simple. However, I’m also setting the number of threads to different amounts, specifically 30, 60, 90, 105, 110, 120, and 135. The logic here is to measure how Laravel and Symfony will perform under different user loads. Unfortunately, I have to set the number of threads for each of the 6 JMeter stress testings separately.
Step 3. Analyze data
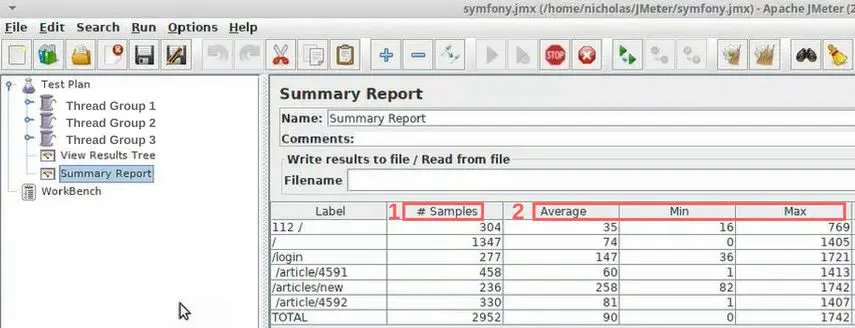
JMeter shows some quality data. Most of it is in the ‘Summary report’:
- #Samples – the total amount of requests to our server;
- Average, Min, Max – the real time it takes to process one request. The numbers are shown in milliseconds;
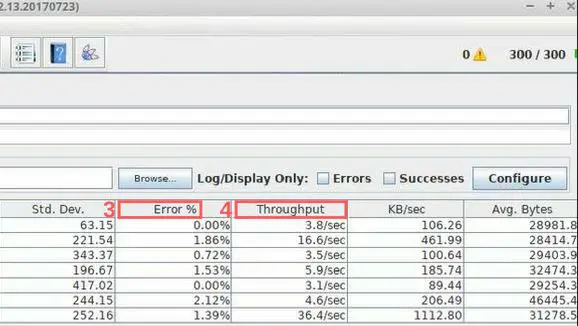
- Error % – the percentage of mistakes with errors;
- Throughput – the number of processed requests in a given period of time.
Some of it is in the ‘View Results Tree.’ Below, you can see the log for each and every website/server request. Moreover, you can analyze those requests that went wrong and/or overloaded your server. The data is quite useful but not full without the help of TerminAll analytics.
Results
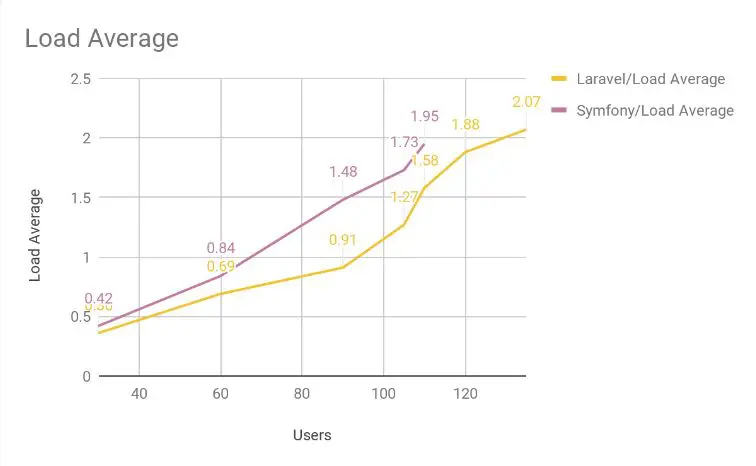
It’s time to reap the fruit of a job well done! Having run the test 6 times with different numbers of threads, I get an interesting picture. The Laravel version of the website is slightly better than the Symfony version. Don’t get me wrong, I don’t claim Laravel is better than Symfony. I’m just reporting the data I see below.
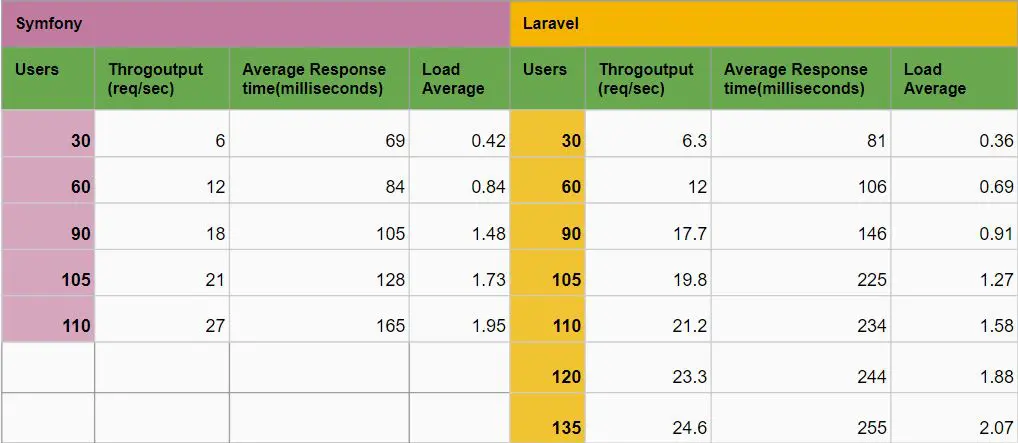
Results table
I have turned these 3 measures into a convenient table comparing Laravel and Symfony. Firstly, you can see Laravel is overloaded with 120 users and can’t keep up with Symfony.
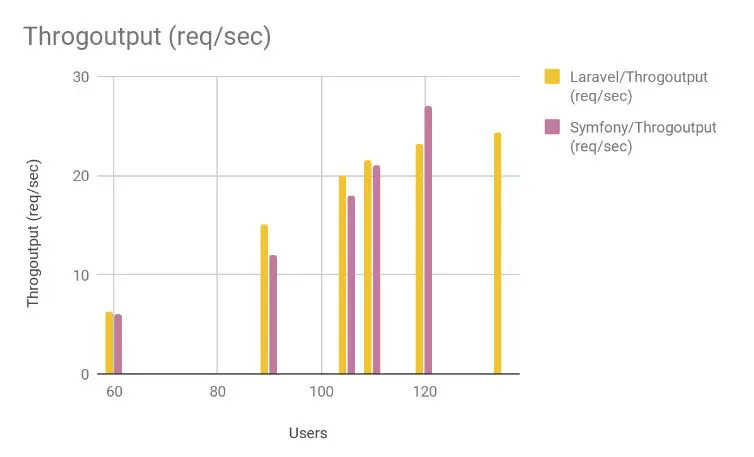
Secondly, Laravel can process a few more requests than Symfony. However, it is overwhelmed by 120 simultaneous users.
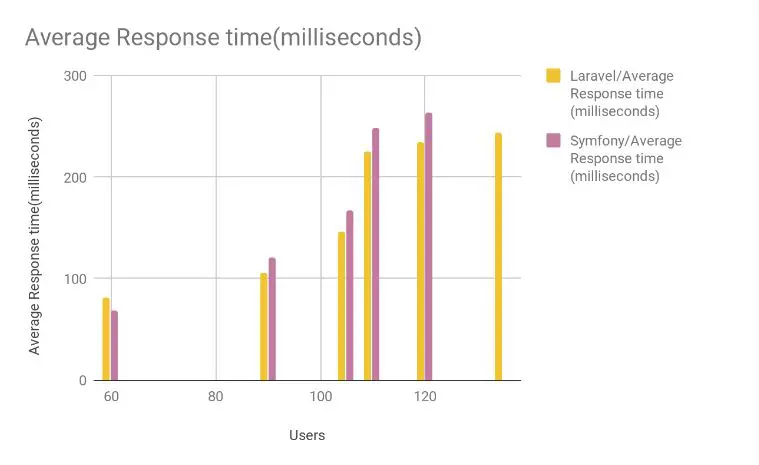
Finally, the Symfony website has a faster average response time than Laravel.
So, that sums up our dive into website stress testing using JMeter! Thanks for reading on, and I hope you find this article useful.
Keep this in mind. DevCom has solid experience with software support and JMeter stress testing. In case you need the following services, contact us.
For more articles related to software development testing, feel free to read AI bots are coming for your testing jobs.
FAQ:
What is stress testing using JMeter?
Website stress testing is a critical part of website development and maintenance. Moreover, if you’re worried about your website’s ability to handle large amounts of traffic, consider conducting a website stress test. Stress testing with JMeter is a technique to evaluate the performance of a website or application under high-load conditions. The thing about a stress test in JMeter is that it can simulate thousands of concurrent users accessing the website simultaneously to identify any bottlenecks, errors, or performance issues. When conducting such stress testing with JMeter, you may identify whether your site can handle high traffic without crashing or slowing down.
How to do stress testing of a website?
To stress-test a website effectively, it’s important to use a combination of automated functional testing tools and manual testing techniques. It is important to know how to perform stress testing in JMeter as it is the best one to optimize your site’s performance. The first step of a stress test with JMeter is to create a load test plan that outlines the scenario you want to simulate and create a thread group list. Later, you conduct the configuration process of JMeter to fit the simulation of a high volume of users and requests that generate heavy traffic. Finally, you analyze the results to identify any issues and optimize the performance under high loads.
What to do with Stress Testing Results?
As soon as you accomplish the JMeter stress test, you turn to analysis. The results point to possible issues with the site’s performance under heavy loads. Having those load test details, you can optimize the website. Remember to run the performance tests again to make sure the changes have improved the performance. Now you are aware of how to use JMeter for stress testing as the complete software testing life-cycle.


